Bar Graph Data Interpretation for Bank Exams: The Short Answer
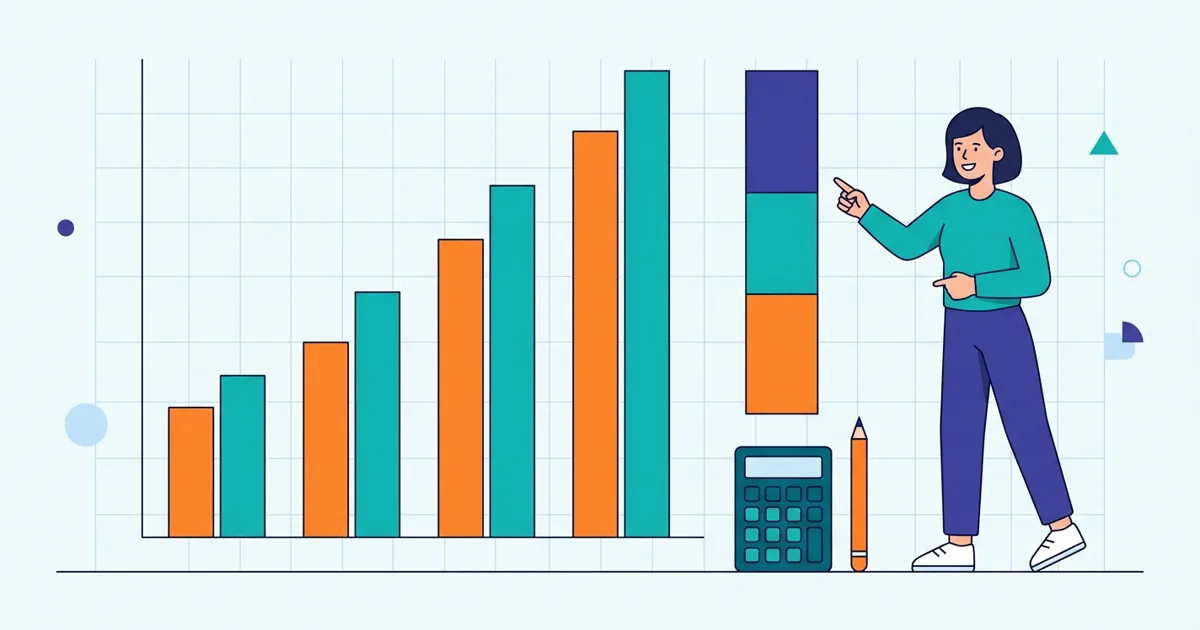
A bar graph shows values as bars of different heights, usually over years or across categories. Bank exam bar graph questions ask for totals, averages, differences, ratios, percentages and percentage change. The two formulas that answer most of them are percentage change = (new − old) ÷ old × 100 and A as a percentage of B = A ÷ B × 100. The main trick is to read every bar into a small table first, then solve each question from the table instead of the graph.
Key takeaway for bank exams: IBPS PO, SBI PO and RRB PO prelims usually set one DI set of 5 questions, and bar graphs (simple, double or stacked) are among the most common types. IBPS and SBI Clerk and SSC CGL Tier 2 also ask bar graph sets. Every value in the solved set below was computed in Python.
Bar graphs need fast percentages, so revise our percentage tricks for SSC CGL and the pie chart data interpretation note too.
Types of Bar Graphs in Data Interpretation
| Type | What it shows | Watch out for |
|---|---|---|
| Simple bar graph | One value per year or category | Scale on the axis (thousands, lakhs, crores) |
| Double (multiple) bar graph | Two or more series side by side (e.g. Company A and B) | Read the legend carefully |
| Stacked bar graph | Parts of a total stacked in one bar | Each segment = top of segment − bottom of segment |
| Horizontal bar graph | Same as simple, bars drawn sideways | Value read on the horizontal axis |
| Bar graph with table | Bar heights plus extra data in a table | Combine both before answering |
Bar Graph DI Formulas (Quick Table)
| Find | Formula |
|---|---|
| Percentage change | (New − Old) ÷ Old × 100 |
| A as % of B | A ÷ B × 100 |
| A is what % more than B | (A − B) ÷ B × 100 |
| Average | Total ÷ number of bars |
| Ratio | A : B (cancel common factors) |
| Share of total | Part ÷ Total × 100 |
Bar Graph Data Interpretation Questions (Solved Set)
Data: The double bar graph shows car production (in thousands) by two companies, A and B, from 2021 to 2025.
| Year | Company A | Company B |
|---|---|---|
| 2021 | 120 | 100 |
| 2022 | 150 | 110 |
| 2023 | 135 | 160 |
| 2024 | 180 | 150 |
| 2025 | 210 | 190 |
Q1. What is the total production of Company A over the five years? 120 + 150 + 135 + 180 + 210 = 795 thousand.
Q2. What is the average yearly production of Company B? Total = 710, so average = 710 ÷ 5 = 142 thousand.
Q3. What is the percentage increase in Company A's production from 2023 to 2024? (180 − 135) ÷ 135 × 100 = 33.33%.
Q4. In 2023, Company B's production was what percent of Company A's? 160 ÷ 135 × 100 = 118.52% (approx.).
Q5. In which year did Company B have its highest growth over the previous year? 2022: 10%; 2023: 45.45%; 2024: −6.25%; 2025: 26.67%. Answer: 2023.
Q6. In how many years did Company B produce more than Company A? Only in 2023 (160 > 135).
Q7. What is the ratio of A's to B's production in 2025? 210 : 190 = 21 : 19.
Q8. By what percent did the combined production rise from 2022 to 2024? 2022 total = 260; 2024 total = 330. (330 − 260) ÷ 260 × 100 = 26.92% (approx.).
Bar Graph with Percentage Values (Profit Percent Type)
A very common bank exam variant shows percentage profit (or growth) as bars, not actual amounts. Here the bar heights cannot be added; you combine them with one given value.
Formula: Profit % = (Income − Expenditure) ÷ Expenditure × 100, so Income = Expenditure × (1 + Profit%/100).
Data: A bar graph shows Company X's profit percentage: 2022: 20%, 2023: 25%, 2024: 40%.
Q1. If the expenditure in 2023 was ₹80 crore, what was the income? 80 × 1.25 = ₹100 crore.
Q2. If the income in 2024 was ₹168 crore, what was the expenditure? 168 ÷ 1.4 = ₹120 crore.
Q3. If the expenditure in 2022 was ₹60 crore, what was the profit? Income = 60 × 1.2 = 72, so profit = ₹12 crore.
Q4. If the expenditures in 2022 and 2023 were equal, what is the ratio of incomes in those years? 1.20 : 1.25 = 24 : 25.
Trap: a higher profit percentage does not always mean a higher profit amount. If the 2022 expenditure were ₹150 crore, its profit at 20% would be ₹30 crore, more than 2023's profit of ₹20 crore at 25% on ₹80 crore. Always multiply by the base before comparing amounts.
Bar Graph vs Line Graph vs Table in DI
| Format | Best for | Reading tip |
|---|---|---|
| Bar graph | Comparing values across years or categories | Note the axis unit and the gap between gridlines |
| Line graph | Showing a trend over time | The steepest segment shows the largest change in value (not always in percentage) |
| Table | Exact values for many items | Scan rows and columns before the questions |
| Pie chart | Share of a total | Use 3.6° = 1% |
Bank exam sets often convert one format into another, for example a bar graph of totals with a line graph of growth rates on the same axes. Treat each series separately, build your table, and then combine.
Bar Graph DI Tricks for IBPS PO and SBI PO
| Trick | Use it when |
|---|---|
| Make a table first | Every set: one quick pass saves re-reading the graph |
| Compare heights before calculating | "Which year had the maximum…" questions |
| Use fraction equivalents | 33.33% = 1/3, 12.5% = 1/8, 16.67% = 1/6 |
| Approximate when options are far apart | e.g. 118.5% vs options 105%, 118%, 125%, 132% |
| Difference first, then divide | Percentage change questions |
| Work in the graph's units | Convert to actual numbers only if the question asks |
Percentage change trick: to compare growth across years, compute (change ÷ old) only for the years where the change looks largest. A big change on a small base (110 → 160) usually beats a similar change on a large base (190 → 210).
Stacked Bar Graph Questions (How to Read Segments)
In a stacked bar, each bar is a total split into coloured parts. Read each part as upper edge − lower edge.
Example: A stacked bar for 2024 shows Online sales from 0 to 45 and Offline sales from 45 to 120 (in thousands). Then Online = 45, Offline = 120 − 45 = 75, and Total = 120. Online share = 45 ÷ 120 × 100 = 37.5%.
Common Mistakes in Bar Graph Questions
- Ignoring the unit (thousands, lakhs, crores, percent) on the axis.
- Using the wrong base for percentage change. The base is always the earlier (old) value.
- Mixing up the legend in double bar graphs.
- Reading a stacked segment as its top value instead of top minus bottom.
- Rounding too early when options are close.
Bar Graph DI Practice Questions (with Answers)
Use the car production table above.
- What is the total production of both companies in 2025? Answer: 400 thousand.
- What is the difference between the five-year totals of A and B? Answer: 85 thousand. 795 − 710.
- What is the average yearly production of Company A? Answer: 159 thousand.
- What is the percentage increase in A's production from 2021 to 2025? Answer: 75%. (210 − 120) ÷ 120 × 100.
- In which year was the combined production the highest? Answer: 2025 (400 thousand).
- What is the percentage increase in B's production from 2022 to 2023? Answer: 45.45% (approx.). 50 ÷ 110 × 100.
- In which year did Company A's production fall compared with the previous year? Answer: 2023. 150 → 135.
- What is the ratio of B's production in 2021 to its production in 2025? Answer: 10 : 19.
- Company A's 2022 production is what percent of its 2025 production? Answer: 71.43% (approx.). 150 ÷ 210 × 100.
- In which year was the gap between A and B the largest? Answer: 2022 (40 thousand). Gaps: 2021 = 20, 2022 = 40, 2023 = 25 (B ahead), 2024 = 30, 2025 = 20.
For timed practice, take the IBPS PO Data Interpretation Practice Test 01, the SBI Clerk Data Interpretation Practice Test 01 and the SSC CGL Data Interpretation Mock Test 01.
Bar Graph Data Interpretation FAQs
How do you solve bar graph DI questions quickly?
Read all bars into a small table, note the unit, then solve each question from the table using the percentage change, ratio and average formulas. Approximate only when the options are far apart.
What is the formula for percentage change in DI?
Percentage change = (new value − old value) ÷ old value × 100. A negative result means a decrease.
What is a stacked bar graph?
A bar graph where each bar is divided into segments that add up to a total. Each segment's value is its top edge minus its bottom edge.
How many DI questions come in IBPS PO prelims?
Usually one DI set of 5 questions in IBPS PO and SBI PO prelims, and several sets in mains. Bar graphs, tables, pie charts and line graphs are the common types.
Are bar graph questions asked in SSC CGL?
Yes. SSC CGL Tier 1 asks occasional single DI questions and Tier 2 asks full DI sets, often on bar graphs and tables.
How do you avoid mistakes in bar graph questions?
Check the axis unit and legend, always use the earlier value as the base for percentage change, and keep at least two decimal places until the final step.
Practice Next
- New DI tests: IBPS Clerk Data Interpretation Mock Test 05, SBI Clerk Data Interpretation Mock Test 03 and IBPS RRB PO Data Interpretation Mock Test 03.
- Mock tests: IBPS PO Data Interpretation Practice Test 01, SBI PO Data Interpretation Practice Test 01, IBPS Clerk Data Interpretation Practice Test 01 and SSC CGL Data Interpretation Mock Test 01, plus IBPS Clerk Data Interpretation Mock Test 02, IBPS PO Caselet DI Mock Test 02.
- Related notes: pie chart data interpretation for bank exams, caselet DI for SBI Clerk, percentage tricks for SSC CGL and average tricks for SSC CGL, plus line graph data interpretation for bank exams.
- Exam details: SBI Clerk 2026 notification and SSC CGL 2026.
- Browse all study notes.